(I) The challenge
Many values, one chart
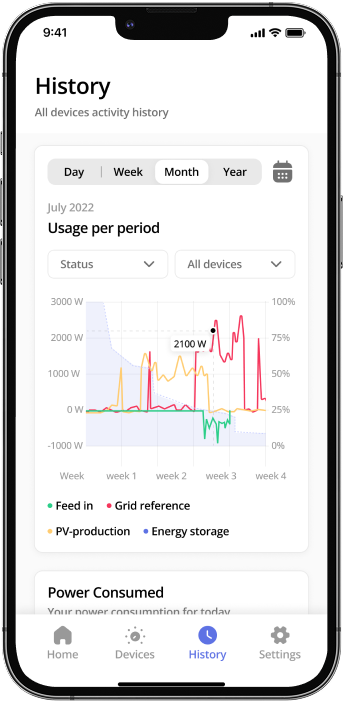
A solar system produces a lot of values at once: feed-in, grid power, PV production and storage. For most people, that is too much. So the history view shows all four as lines in one chart. You pick day, week, month or year and filter by device. Tap a point and you see the exact value.
(II) The solution
Adding devices step by step
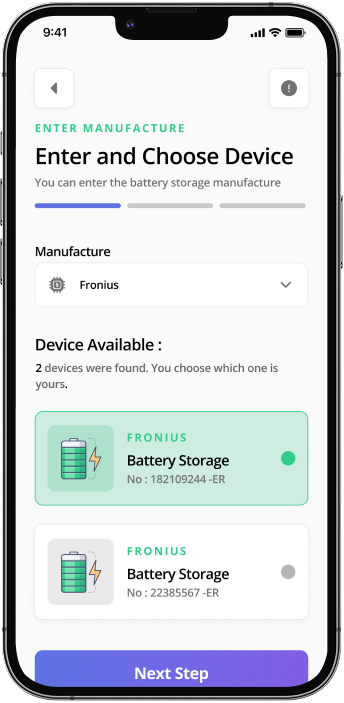
Adding a new device should not need a manual. You pick the manufacturer, the app shows you the devices it found, and you tap yours. A bar at the top shows how far along you are, and each step asks only one thing.
(III) The tech
Connecting the electricity meter
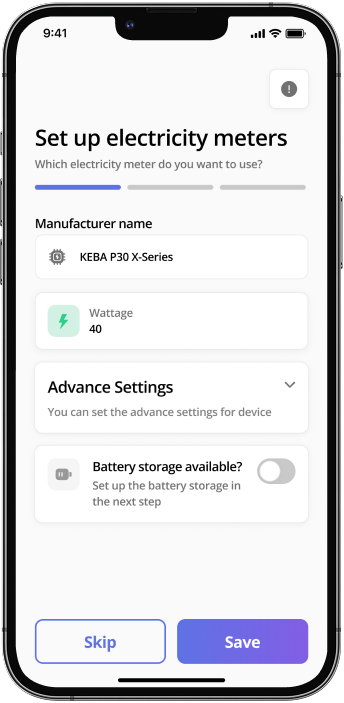
For the electricity meter, you pick the manufacturer and model and enter the wattage. If you want more control, you open the advanced settings. If you have a battery, you say so here with one switch, and it is set up in the next step. We designed everything in Figma and FigJam.
- Design & Prototyping
- FigmaFigJam
(IV) The impact
Your day at a glance
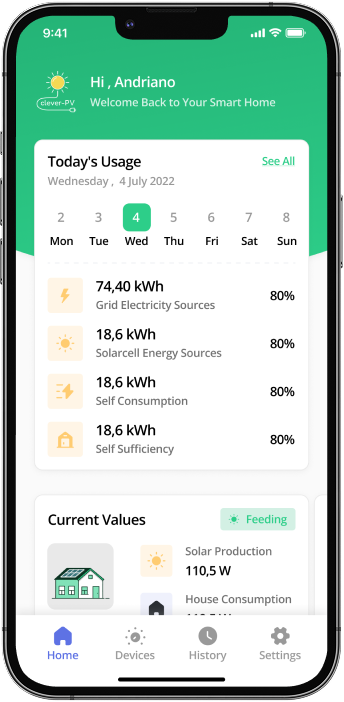
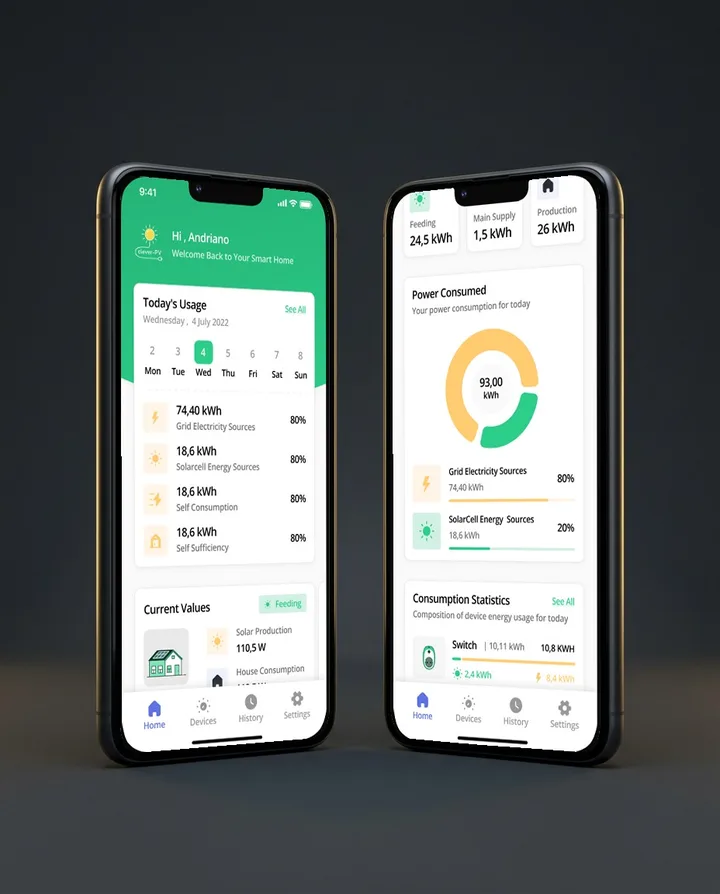
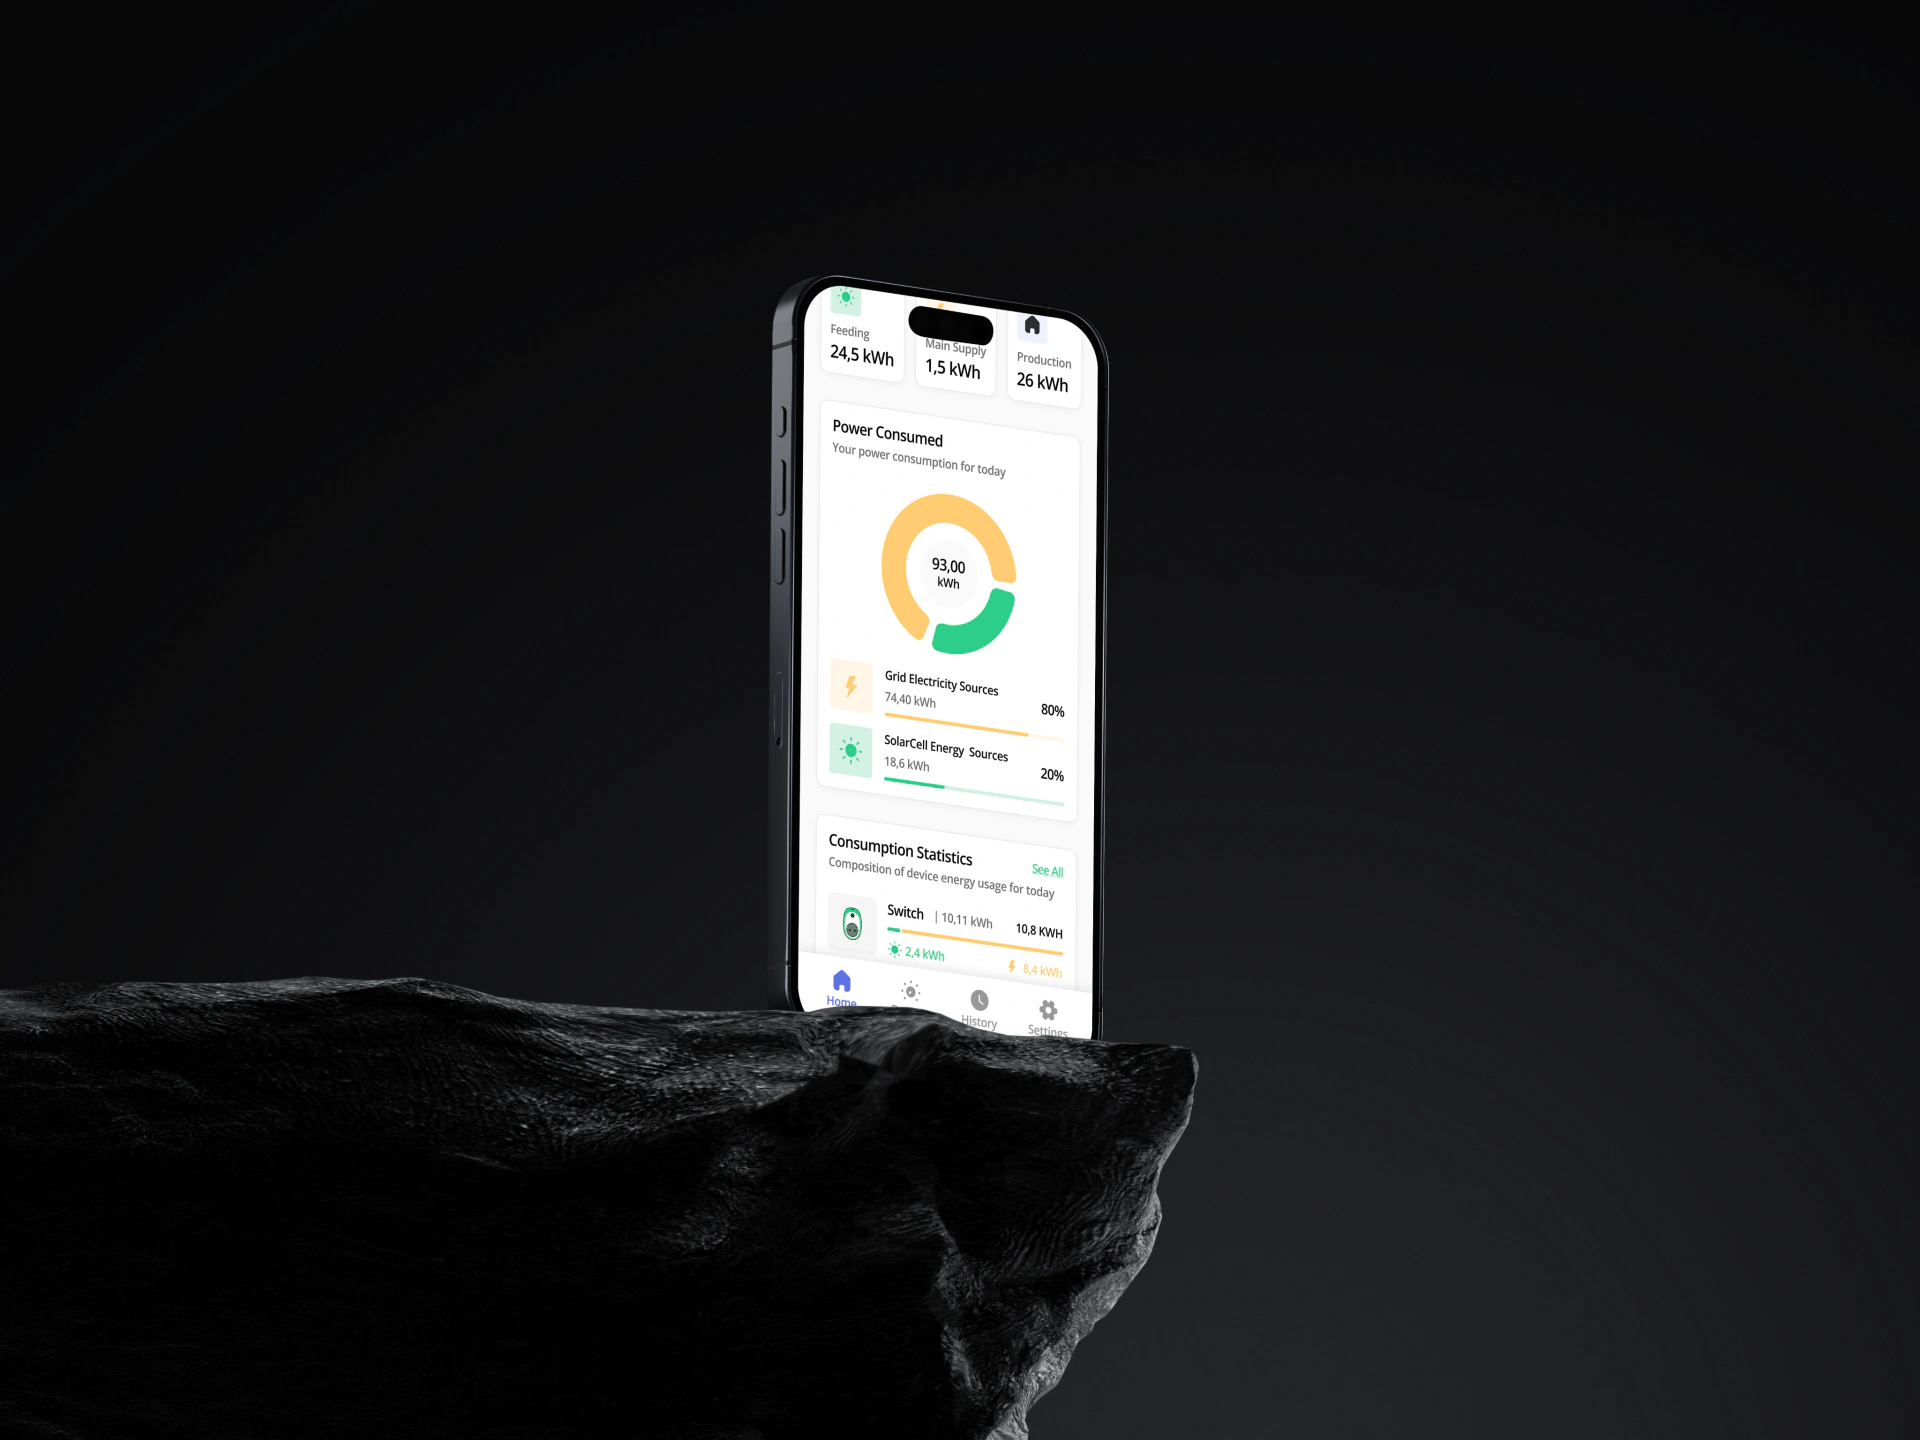
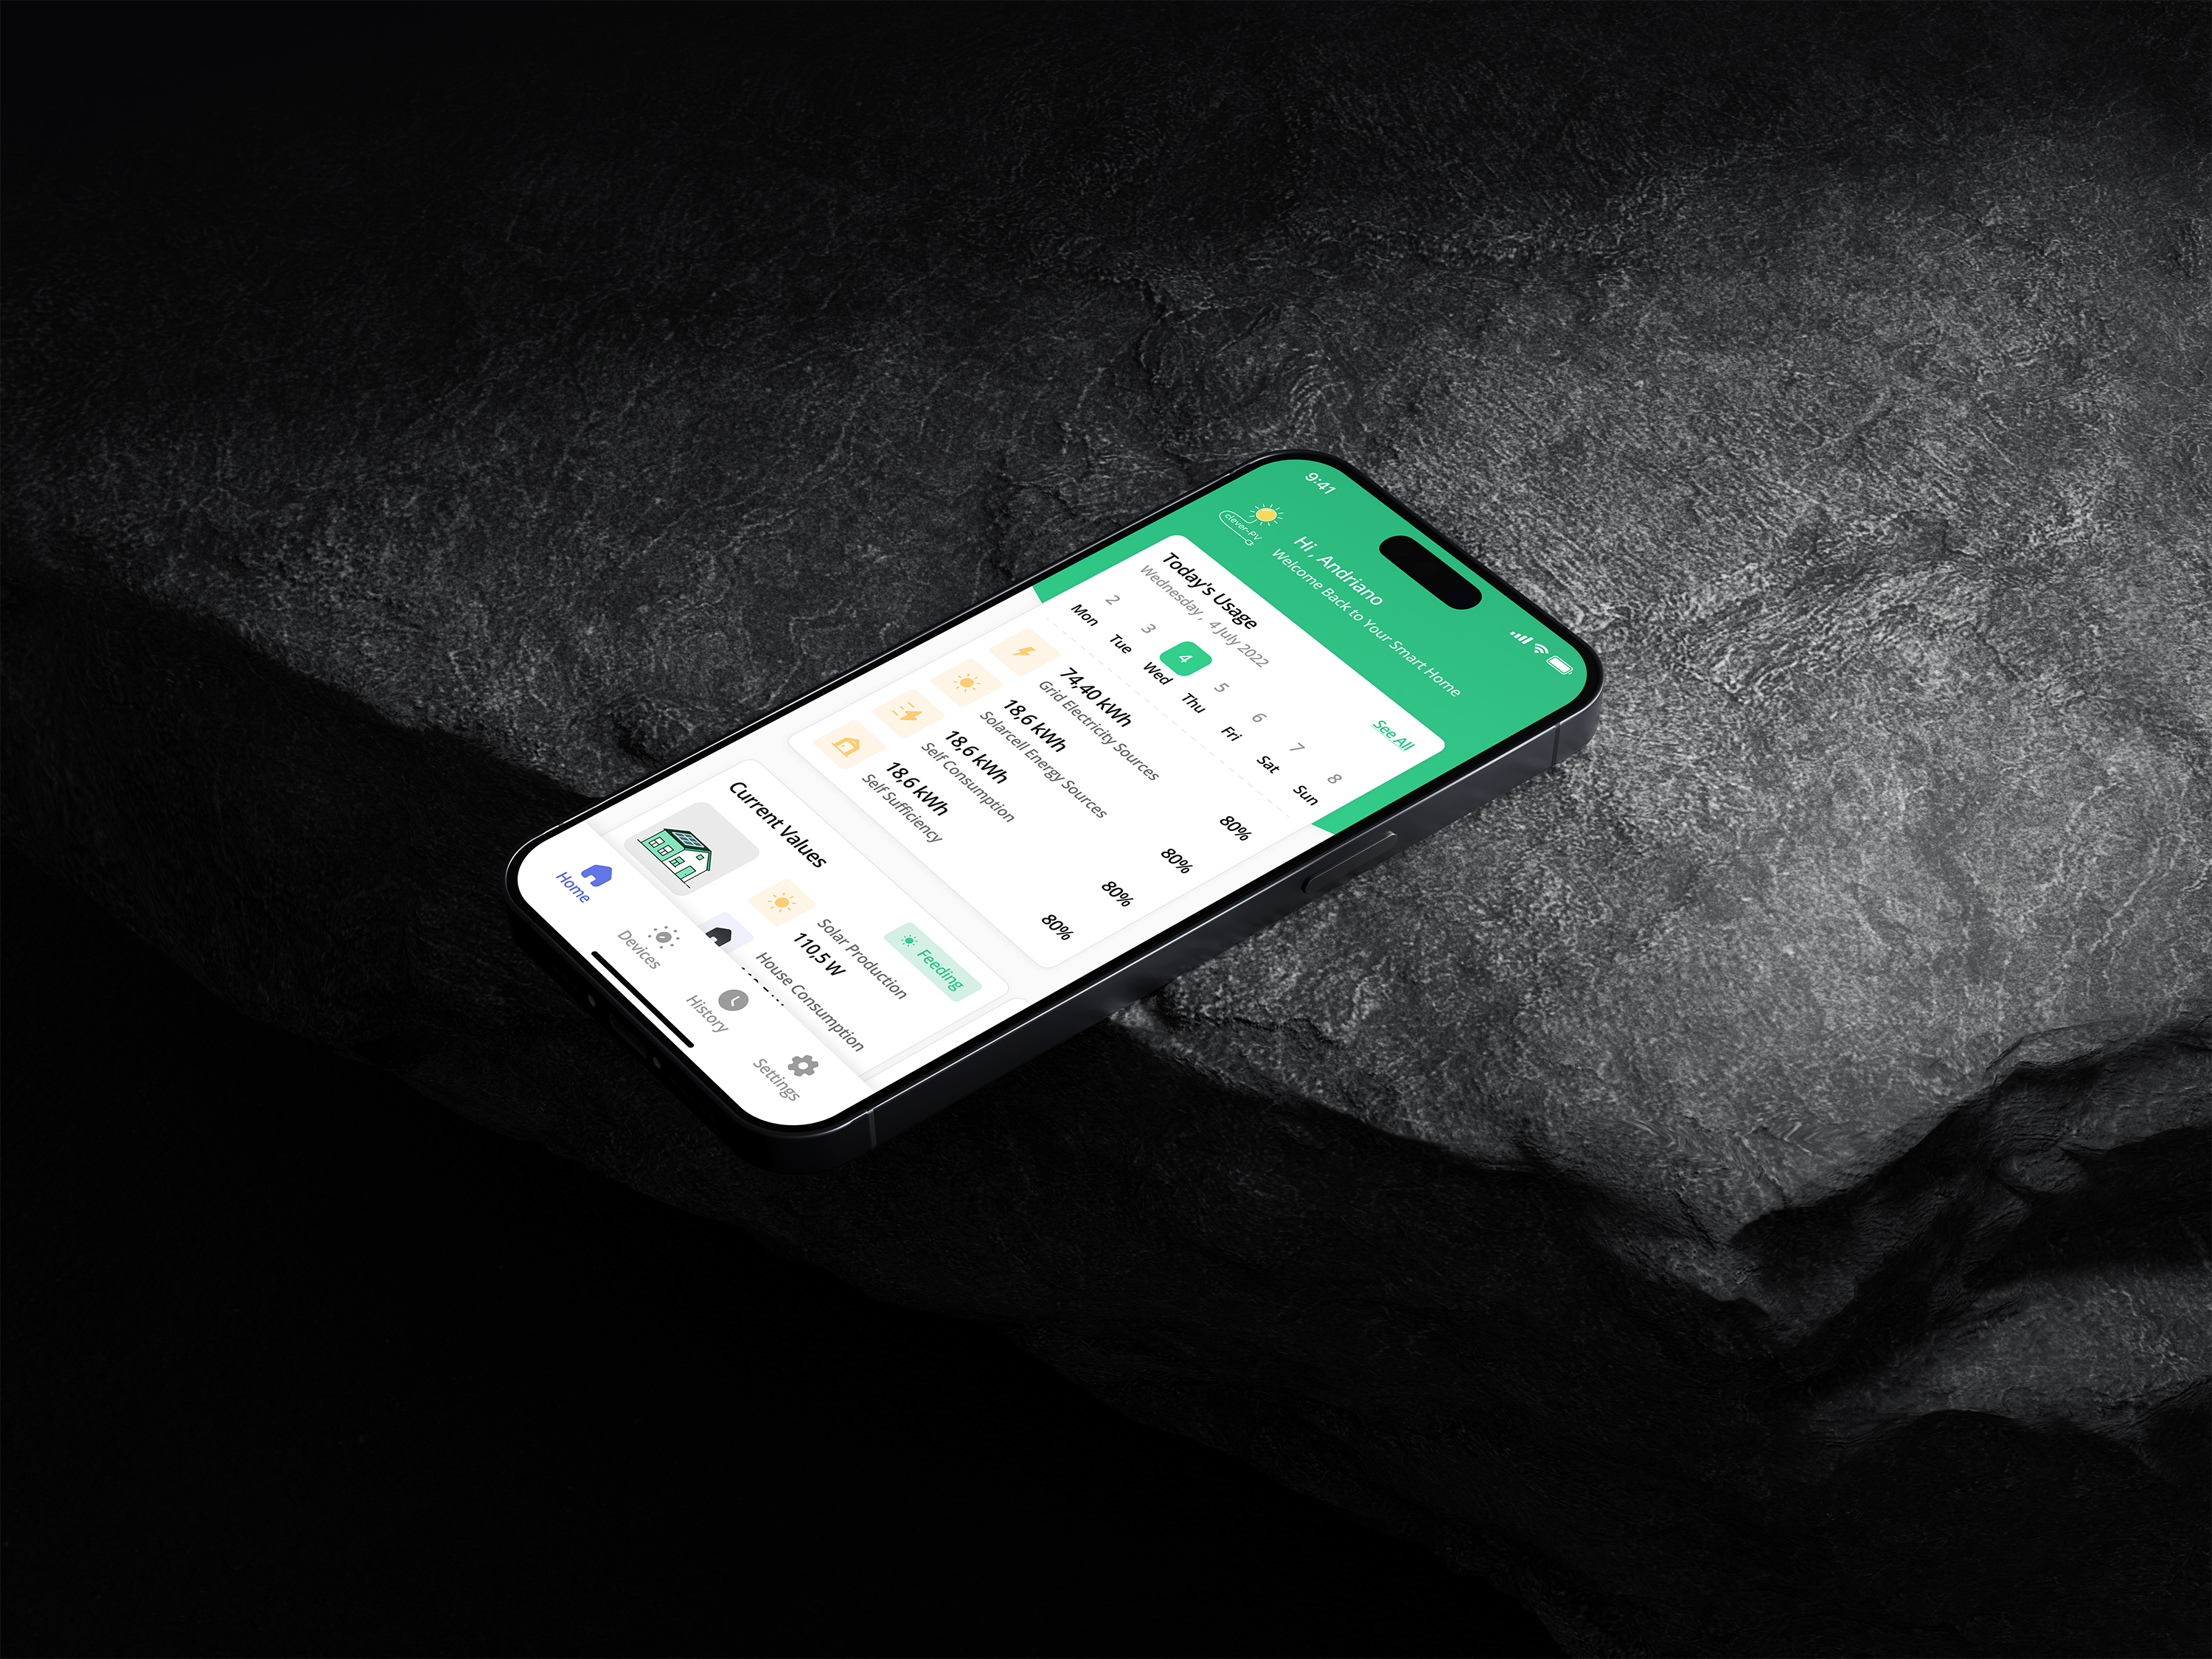
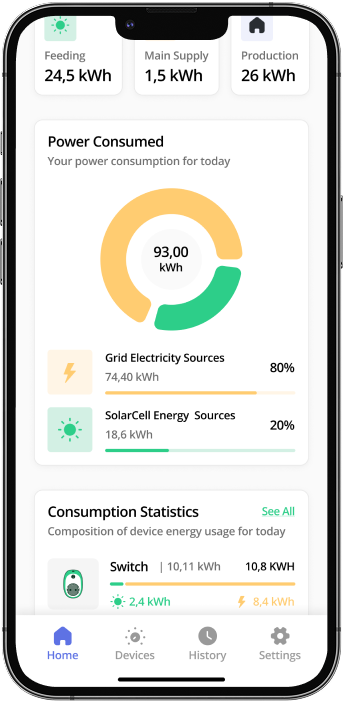
The home screen shows what is happening today: power from the grid, power from your solar panels, self-consumption and self-sufficiency. Below that are the current values: feed-in, solar production and home consumption.
That way you can plan your usage around when your system produces power.